Executive Summary
This project analyzes manufacturing downtime to identify production losses, major downtime causes, equipment performance issues, and opportunities for operational improvement. Through an interactive Power BI dashboard, operational data is transformed into actionable insights that support production monitoring, root-cause analysis, and data-driven decision-making.
Dashboard Preview
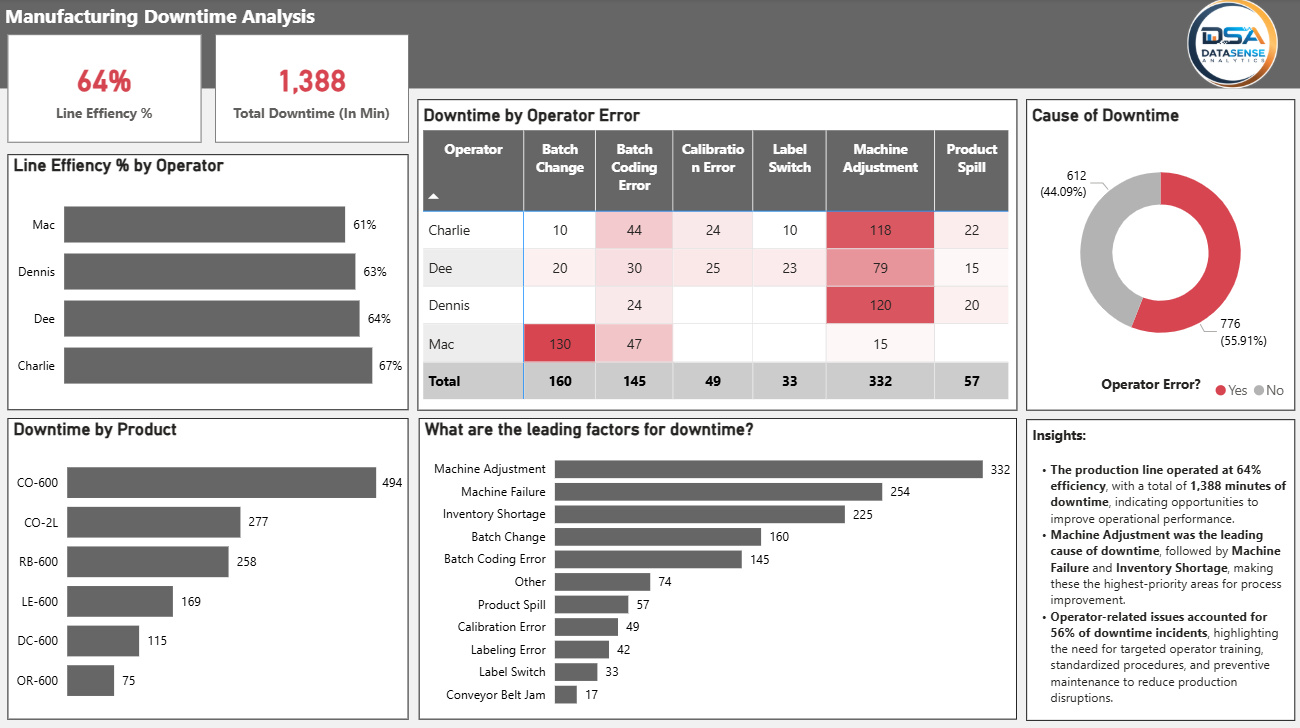
Business Context
Manufacturing operations depend on equipment availability, production efficiency, and consistent process performance. Unplanned downtime can interrupt production, reduce output, and increase operational costs. Decision-makers require centralized visibility into downtime patterns to identify recurring issues and prioritize improvement opportunities.
Business Challenge
- What are the primary causes of production downtime?
- Which downtime reasons contribute most to production losses?
- Which equipment or production areas experience the greatest downtime?
- When do downtime events occur most frequently?
- Where should operational improvement efforts be prioritized?
Project Objectives
- Analyze manufacturing downtime patterns.
- Identify major causes of production downtime.
- Evaluate equipment and operational performance.
- Identify recurring downtime issues.
- Support data-driven operational improvement.
Dataset Overview
| Category | Details |
|---|---|
| Industry | Manufacturing |
| Visualization | Microsoft Power BI |
| Preparation | Power Query |
| Calculations | DAX |
| Scope | Manufacturing Downtime Records |
Analytics Approach
- Data Cleaning
- Data Transformation
- Data Modeling
- Downtime Analysis
- KPI Development
- Dashboard Design
- Business Storytelling
Key Performance Indicators
- Total Downtime
- Downtime Events
- Average Downtime
- Downtime by Cause
- Downtime by Equipment
- Production Performance
Executive Findings
Downtime is concentrated among specific operational causes.
The analysis highlights recurring downtime reasons that contribute disproportionately to production interruptions, providing clear areas for root-cause investigation and corrective action.
Equipment performance varies across the operation.
Certain machines or production areas experience greater downtime exposure, indicating opportunities to prioritize maintenance and operational improvement efforts.
Downtime patterns provide opportunities for preventive action.
Analyzing downtime by cause, equipment, and operational period enables management to identify recurring patterns and shift from reactive response toward more proactive improvement.
Business Recommendations
- Prioritize the highest-impact downtime causes for root-cause analysis.
- Focus maintenance efforts on equipment with recurring downtime issues.
- Monitor downtime KPIs regularly to identify emerging operational problems.
- Use historical downtime patterns to support preventive maintenance planning.
- Standardize downtime reporting to improve operational visibility and accountability.
Technical Highlights
- Microsoft Power BI
- DAX Measures
- Power Query
- Interactive Dashboard Design
- Operational KPI Development
- Data Modeling
Business Value Delivered
The dashboard provides management with centralized visibility into production downtime, helping identify major operational losses, evaluate equipment performance, prioritize improvement opportunities, and support more data-driven maintenance and production decisions.
Skills Demonstrated
- Business Intelligence
- Operational Analytics
- Data Visualization
- Executive Reporting
- Data Modeling
- Root-Cause Analysis
- Business Storytelling
Tools Used
- Microsoft Power BI
- Power Query
- DAX
- Microsoft Excel
Project Outcome
This project demonstrates an end-to-end Business Intelligence workflow, transforming manufacturing downtime data into an executive-ready analytical dashboard that supports operational monitoring, root-cause analysis, maintenance planning, and continuous improvement.