Executive Summary
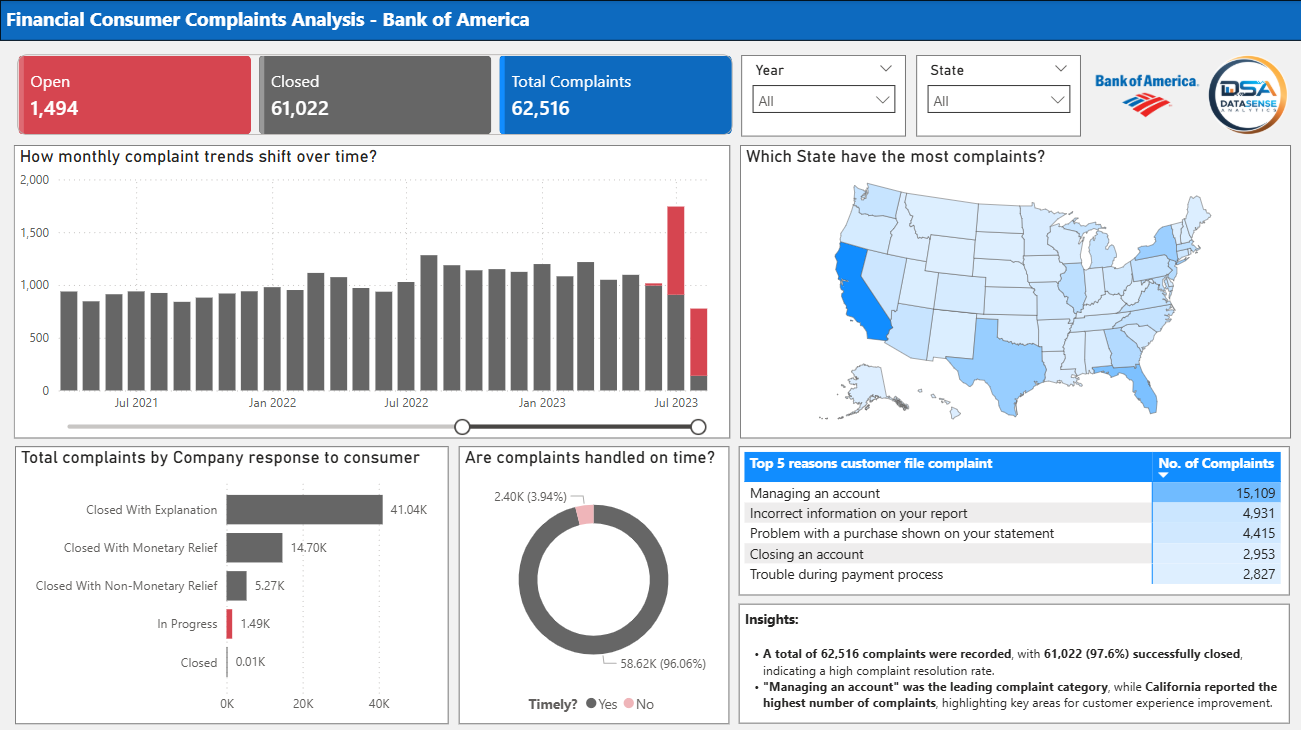
This project analyzes consumer complaints related to financial products and services to identify complaint trends, recurring customer issues, product-level concerns, and opportunities for service improvement. Through an interactive Power BI dashboard, the project transforms complaint data into actionable insights that support customer experience management, operational improvement, and data-driven decision-making.
Dashboard Preview
Business Context
Financial institutions receive large volumes of consumer complaints across products, services, and customer interactions. Understanding where complaints originate, which issues occur most frequently, and how effectively they are resolved is essential for improving customer experience and identifying operational risks.
Business Challenge
- Which financial products generate the most consumer complaints?
- What complaint issues occur most frequently?
- Which products or services require greater attention?
- How effectively are consumer complaints being resolved?
- Where are the largest opportunities for customer experience improvement?
Project Objectives
- Analyze consumer complaint trends.
- Identify the products generating the highest complaint volumes.
- Determine the most common complaint issues.
- Evaluate complaint resolution performance.
- Identify opportunities to improve customer experience and operations.
Dataset Overview
| Category | Details |
|---|---|
| Industry | Banking & Financial Services |
| Visualization | Microsoft Power BI |
| Preparation | Power Query |
| Calculations | DAX |
| Scope | Financial Consumer Complaints |
Analytics Approach
- Data Cleaning
- Data Transformation
- Data Modeling
- Complaint KPI Development
- Trend Analysis
- Dashboard Design
- Business Storytelling
Key Performance Indicators
- Total Complaints
- Resolved Complaints
- Complaint Resolution Rate
- Complaint Volume by Product
- Complaint Volume by Issue
- Complaint Trends Over Time
Executive Findings
Complaint volumes vary significantly across financial products.
Certain financial products generate substantially higher complaint volumes, highlighting areas where customer experience and service processes require closer monitoring.
Recurring complaint issues reveal opportunities for process improvement.
The concentration of complaints around specific issues indicates recurring customer pain points that can be prioritized for root-cause analysis and operational improvement.
Complaint resolution performance provides an important customer experience indicator.
Monitoring resolution outcomes alongside complaint volume helps identify areas where customer issues may require faster or more effective resolution.
Business Recommendations
- Prioritize high-volume complaint categories for root-cause analysis.
- Focus process improvement efforts on products with consistently high complaint activity.
- Monitor complaint resolution performance as a customer experience KPI.
- Establish recurring complaint trend monitoring for early identification of emerging issues.
- Use complaint insights to improve customer service processes and product experiences.
Technical Highlights
- Microsoft Power BI
- DAX Measures
- Power Query
- Interactive Dashboard Design
- Customer Experience KPI Development
Business Value Delivered
The dashboard provides a centralized view of consumer complaints, enabling decision-makers to identify recurring customer issues, monitor resolution performance, prioritize improvement opportunities, and strengthen customer experience management.
Skills Demonstrated
- Business Intelligence
- Data Visualization
- Customer Experience Analytics
- Data Modeling
- Executive Reporting
- Business Storytelling
Tools Used
- Microsoft Power BI
- Power Query
- DAX
- Microsoft Excel
Project Outcome
This project demonstrates an end-to-end Business Intelligence workflow, transforming consumer complaint data into an executive-ready dashboard that supports customer experience analysis, operational improvement, and data-driven decision-making.