Executive Summary
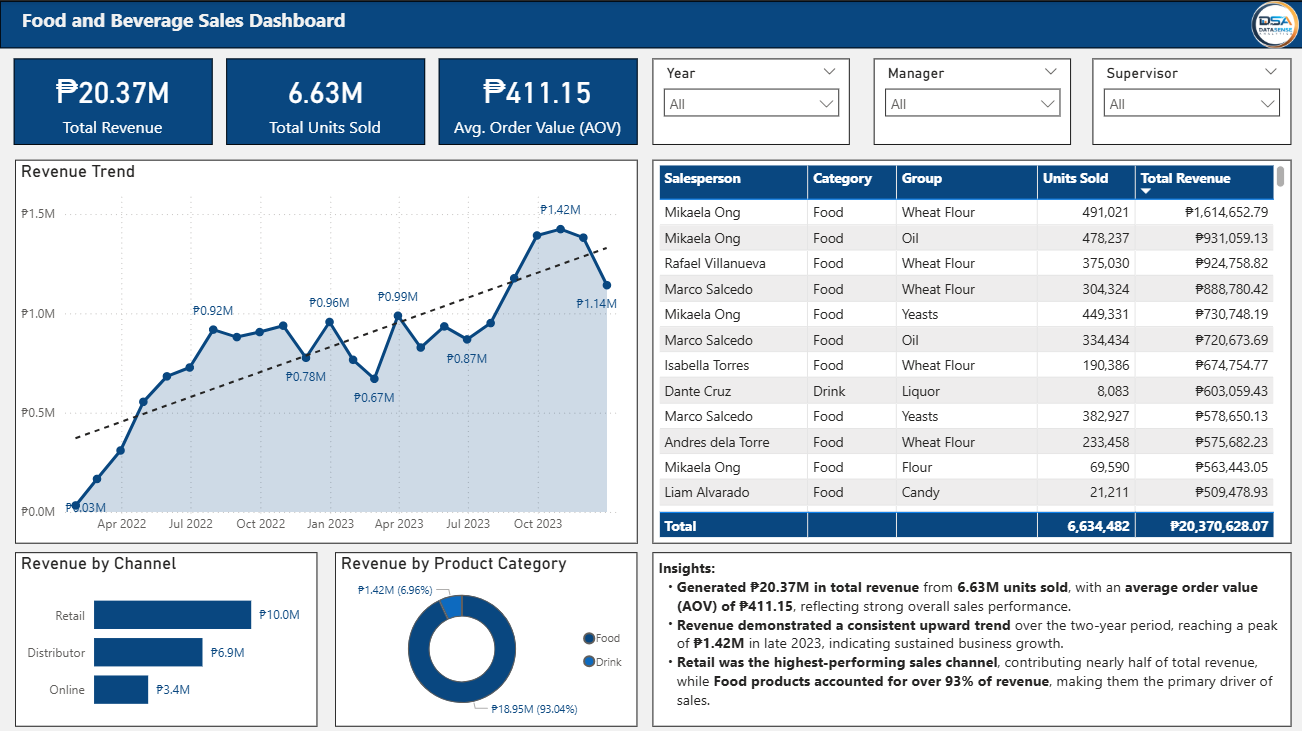
This project analyzes food and beverage sales data to uncover revenue trends, product performance, profitability, and customer purchasing behavior. Through an interactive Power BI dashboard, the project transforms raw sales data into actionable insights that support performance monitoring, product evaluation, and data-driven business decision-making.
Dashboard Preview
Business Context
Food and beverage businesses operate in highly competitive environments where revenue, product performance, profitability, and customer purchasing behavior directly influence business performance. Centralized sales reporting enables decision-makers to monitor performance, identify opportunities, and support more informed commercial strategies.
Business Challenge
- Which products generate the highest sales?
- Which products contribute most to overall business performance?
- How is revenue distributed across products and categories?
- Which products demonstrate stronger profitability?
- What customer purchasing patterns can be identified?
Project Objectives
- Analyze overall food and beverage sales performance.
- Evaluate revenue and product performance.
- Identify high-performing and underperforming products.
- Analyze profitability across the product portfolio.
- Understand customer purchasing behavior.
Dataset Overview
| Category | Details |
|---|---|
| Industry | Food & Beverage |
| Visualization | Microsoft Power BI |
| Preparation | Power Query |
| Calculations | DAX |
| Scope | Food & Beverage Sales Data |
Analytics Approach
- Data Cleaning
- Data Transformation
- Data Modeling
- KPI Development
- Dashboard Design
- Business Storytelling
Key Performance Indicators
- Total Sales
- Total Revenue
- Product Performance
- Profitability
- Customer Purchasing Behavior
- Sales Performance Trends
Executive Findings
Product performance varies across the portfolio.
Analyzing sales performance highlights differences between products and helps identify products that contribute more strongly to overall business performance.
Revenue performance provides visibility into commercial opportunities.
Monitoring revenue across products and sales dimensions enables decision-makers to identify stronger-performing areas and evaluate opportunities for improving overall sales performance.
Profitability provides an additional perspective beyond sales volume.
Evaluating profitability alongside sales performance helps distinguish products that generate strong commercial value from products that may require further review.
Business Recommendations
- Prioritize high-performing products in sales and promotional strategies.
- Monitor product profitability alongside revenue performance.
- Review underperforming products to identify improvement opportunities.
- Use customer purchasing insights to support product and sales planning.
Technical Highlights
- Microsoft Power BI
- DAX Measures
- Power Query
- Interactive Dashboard Design
- Executive KPI Development
Business Value Delivered
The dashboard provides decision-makers with centralized visibility into sales performance, revenue, product contribution, profitability, and customer purchasing behavior, enabling more informed commercial and operational decisions.
Skills Demonstrated
- Business Intelligence
- Data Visualization
- Executive Reporting
- Data Modeling
- Business Storytelling
Tools Used
- Microsoft Power BI
- Power Query
- DAX
- Microsoft Excel
Project Outcome
This project demonstrates an end-to-end Business Intelligence workflow, transforming raw food and beverage sales data into an executive-ready dashboard that supports sales performance monitoring, product evaluation, profitability analysis, and data-driven business decision-making.