Executive Summary
This project analyzes financial performance data to provide centralized visibility into revenue, expenses, profitability, and overall business performance. Through an interactive Power BI dashboard, the project transforms financial data into actionable insights that support performance monitoring, financial planning, and data-driven executive decision-making.
Dashboard Preview
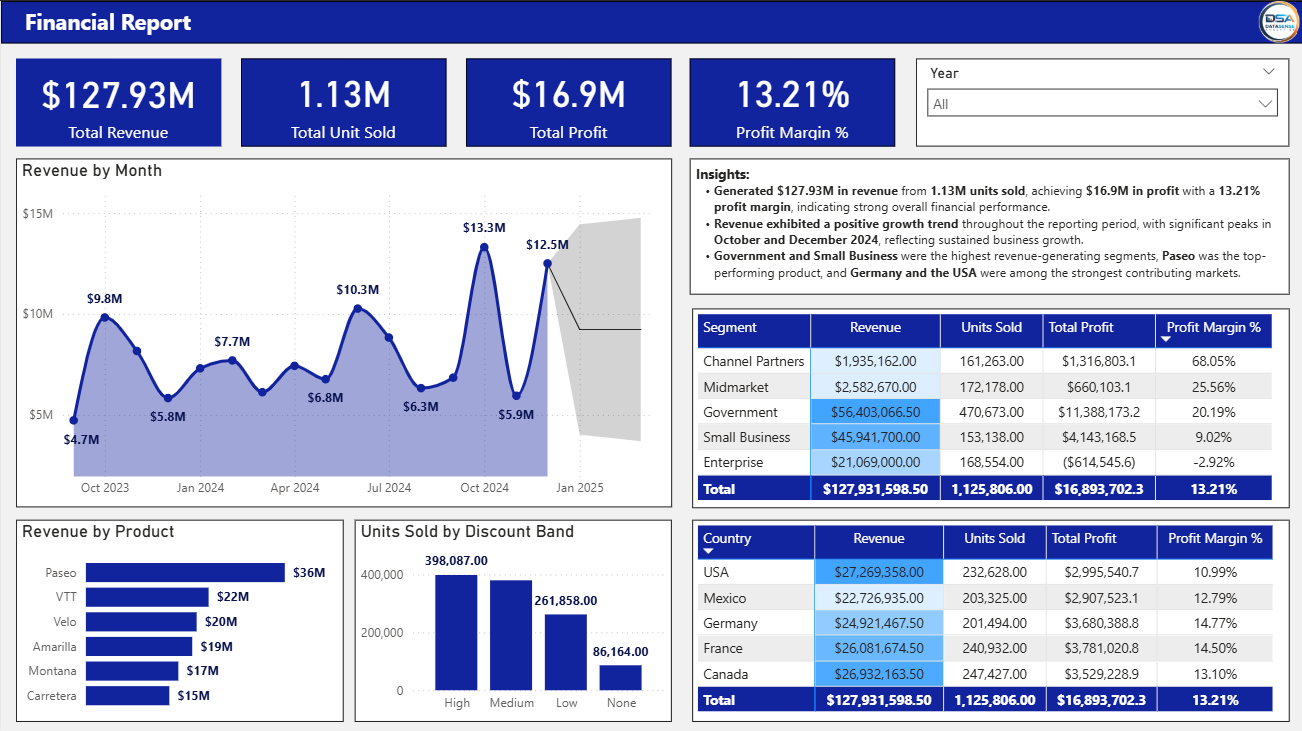
Business Context
Organizations require timely and centralized financial reporting to monitor business performance, understand profitability, and identify areas that require management attention. A structured financial dashboard enables decision-makers to evaluate financial trends and performance indicators through a single reporting solution.
Business Challenge
- How is overall financial performance trending?
- Which areas contribute most to revenue and profitability?
- How do expenses impact overall financial performance?
- Which financial periods or segments require management attention?
- How can financial reporting support better business decisions?
Project Objectives
- Analyze overall financial performance.
- Monitor revenue and expense trends.
- Evaluate profitability indicators.
- Identify financial performance patterns.
- Support executive financial decision-making.
Dataset Overview
| Category | Details |
|---|---|
| Industry | Finance |
| Visualization | Microsoft Power BI |
| Preparation | Power Query |
| Calculations | DAX |
| Scope | Financial Performance Data |
Analytics Approach
- Data Cleaning
- Data Transformation
- Data Modeling
- KPI Development
- Financial Performance Analysis
- Dashboard Design
- Business Storytelling
Key Performance Indicators
- Total Revenue
- Total Expenses
- Profit
- Profit Margin
- Revenue Growth
- Financial Performance
Executive Findings
Revenue performance provides a clear view of business growth.
Monitoring revenue trends enables decision-makers to evaluate overall business performance and identify periods of stronger or weaker financial activity.
Expense management is important to maintaining profitability.
Analyzing expenses alongside revenue provides visibility into the factors influencing overall financial performance and profitability.
Profitability indicators support more informed financial decisions.
Monitoring profit and margin indicators helps management evaluate financial efficiency and identify opportunities to improve business performance.
Business Recommendations
- Monitor revenue and profitability KPIs regularly.
- Analyze expense trends to identify potential cost optimization opportunities.
- Track financial performance across reporting periods.
- Use centralized financial reporting to support management decision-making.
Technical Highlights
- Microsoft Power BI
- DAX Measures
- Power Query
- Interactive Dashboard Design
- Executive KPI Development
Business Value Delivered
The dashboard provides management with centralized visibility into financial performance, revenue, expenses, and profitability, enabling more informed financial monitoring, performance evaluation, and business planning.
Skills Demonstrated
- Business Intelligence
- Financial Analysis
- Data Visualization
- Executive Reporting
- Data Modeling
- Business Storytelling
Tools Used
- Microsoft Power BI
- Power Query
- DAX
- Microsoft Excel
Project Outcome
This project demonstrates an end-to-end Business Intelligence workflow, transforming financial data into an executive-ready reporting dashboard that supports performance monitoring, profitability analysis, financial planning, and data-driven decision-making.