Executive Summary
This project analyzes Airbnb listings across global cities to uncover pricing trends, neighborhood performance, customer satisfaction, and market opportunities. Through interactive Power BI dashboards, the project transforms raw marketplace data into actionable insights that support strategic pricing, investment planning, and executive decision-making.
Dashboard Preview
Business Context
Airbnb hosts and property managers operate within highly competitive markets where pricing, occupancy, guest satisfaction, and location all influence business performance. Decision-makers require centralized reporting to identify opportunities and optimize marketplace strategies.
Business Challenge
- Which cities command the highest listing prices?
- Which neighborhoods generate the greatest activity?
- How competitive is each market?
- How does customer satisfaction compare across cities?
- Where should investment be prioritized?
Project Objectives
- Analyze global Airbnb marketplace performance.
- Compare pricing across cities.
- Evaluate guest satisfaction.
- Identify high-performing neighborhoods.
- Support executive decision-making.
Dataset Overview
| Category | Details |
|---|---|
| Industry | Hospitality |
| Visualization | Microsoft Power BI |
| Preparation | Power Query |
| Calculations | DAX |
| Scope | Global Airbnb Listings |
Analytics Approach
- Data Cleaning
- Data Transformation
- Data Modeling
- KPI Development
- Dashboard Design
- Business Storytelling
Key Performance Indicators
- Total Listings
- Total Hosts
- Average Listing Price
- Average Guest Rating
- Property Type
- Bedrooms
Executive Findings
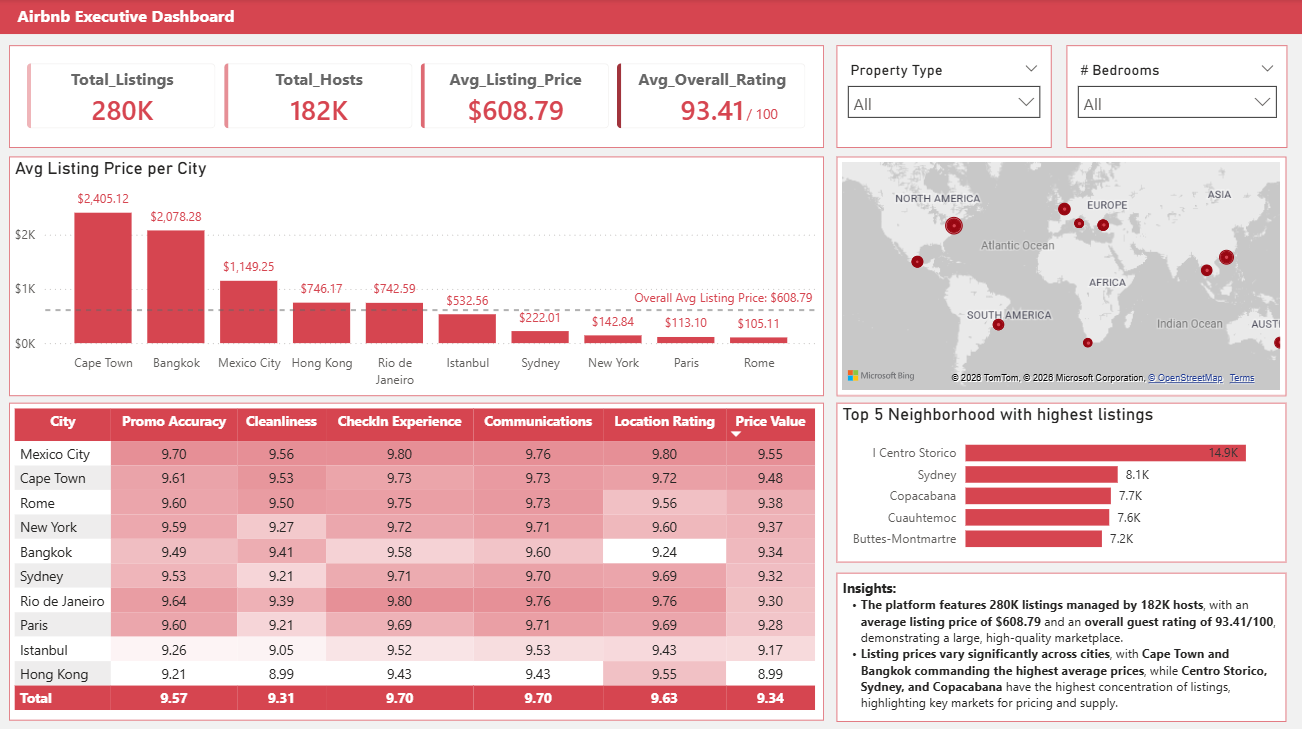
Pricing differs significantly across cities.
Cape Town and Bangkok command substantially higher listing prices than most other cities.
High-density neighborhoods dominate listing activity.
Centro Storico contains the highest concentration of listings within the marketplace.
Customer satisfaction remains consistently high.
Cities maintain review scores above 9.0 across multiple service dimensions.
Business Recommendations
- Implement localized pricing strategies.
- Prioritize investment in high-demand neighborhoods.
- Continue monitoring customer satisfaction KPIs.
- Analyze premium-priced cities for best practices.
Technical Highlights
- Microsoft Power BI
- DAX Measures
- Power Query
- Interactive Dashboard Design
- Executive KPI Development
Business Value Delivered
The dashboard enables executives to compare markets, evaluate pricing strategies, identify investment opportunities, and support data-driven business decisions through centralized reporting.
Skills Demonstrated
- Business Intelligence
- Data Visualization
- Executive Reporting
- Data Modeling
- Business Storytelling
Tools Used
- Microsoft Power BI
- Power Query
- DAX
- Microsoft Excel
Project Outcome
This project demonstrates an end-to-end Business Intelligence workflow, transforming raw marketplace data into an executive-ready dashboard that supports strategic pricing, operational planning, and investment decisions.