Executive Summary
This project analyzes customer data from a banking environment to identify the key factors associated with customer churn, high-risk customer segments, and opportunities to improve customer retention.
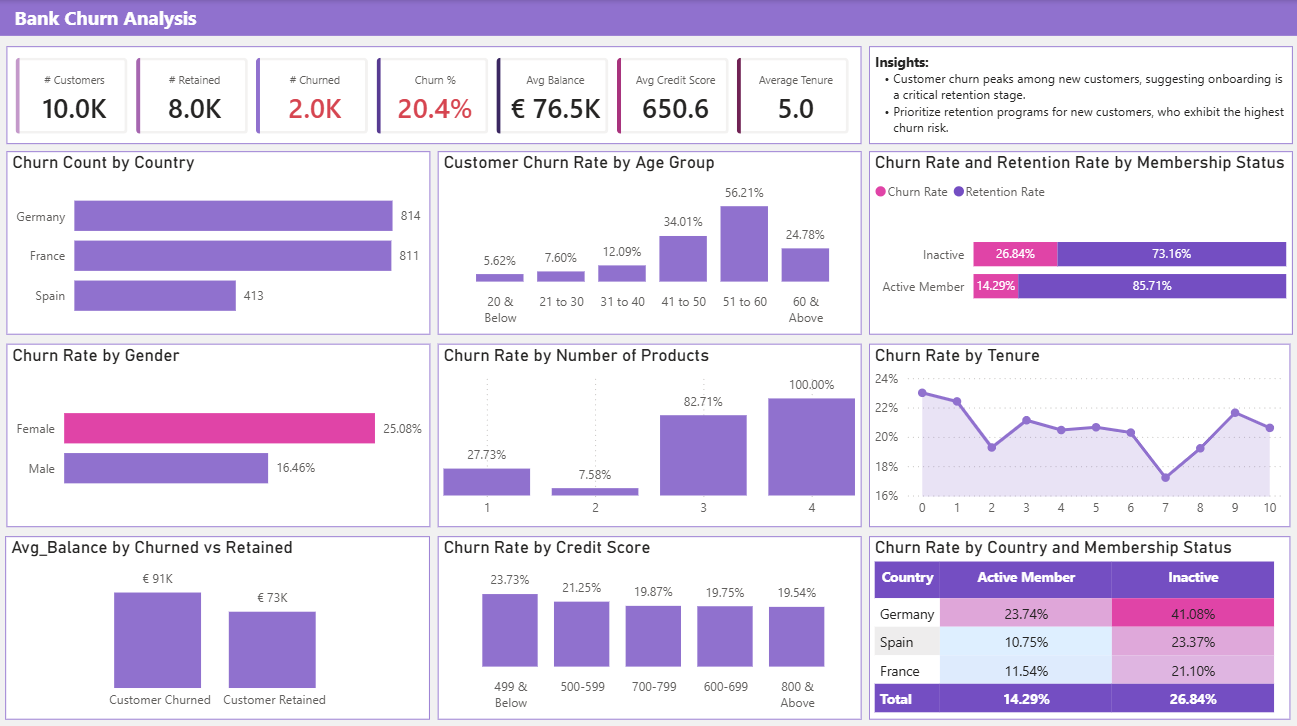
Through an interactive Power BI dashboard, customer demographics, account behavior, product usage, activity, and geographic characteristics are analyzed to transform raw customer data into actionable retention insights.
Dashboard Preview
Business Context
Customer retention is a critical challenge for financial institutions because acquiring a new customer can require significantly more resources than retaining an existing one.
Understanding which customer characteristics and behaviors are associated with churn enables management teams to prioritize retention initiatives, improve customer engagement, and allocate resources toward higher-risk segments.
Business Problem
The organization needs to understand why customers leave and which customer segments demonstrate a higher likelihood of churn.
Without centralized analysis, it can be difficult to identify patterns across customer demographics, geography, account activity, product usage, and financial characteristics.
Key Business Questions
- Which customer segments have the highest churn rates?
- Which customer characteristics are associated with churn?
- Does customer activity influence retention?
- Which geographic markets demonstrate higher churn risk?
- Does the number of products held by a customer relate to churn?
- Which customer segments should receive greater retention attention?
Project Objectives
- Measure overall customer churn performance.
- Identify demographic and behavioral characteristics associated with customer churn.
- Compare churn performance across geographic markets.
- Analyze customer activity and product ownership.
- Identify high-risk customer segments.
- Develop an executive-ready Power BI dashboard for data-driven retention decisions.
Dataset Overview
The analysis uses a customer banking dataset containing 10,000 customer records.
| Category | Fields |
|---|---|
| Customer Profile | Customer ID, Surname, Gender, Age |
| Financial Profile | Credit Score, Balance, Estimated Salary |
| Account Information | Tenure, Number of Products, Credit Card Ownership |
| Engagement | Active Membership |
| Geography | France, Germany, Spain |
| Outcome | Exited / Customer Churn |
Analytics Approach
The analysis follows a structured Business Intelligence workflow from data preparation through executive reporting.
- Data review and quality assessment
- Data preparation and transformation using Power Query
- Data modeling and relationship validation
- KPI development using DAX
- Customer segmentation and comparative analysis
- Interactive visualization using Power BI
- Business interpretation and recommendation development
Key Performance Indicators
- Total Customers
- Exited Customers
- Customer Churn Rate
- Active Customers
- Inactive Customers
- Average Customer Age
- Average Credit Score
- Average Account Balance
Key Insights
Germany demonstrates the highest churn risk.
Among the three geographic markets, Germany shows the highest customer churn rate, indicating a potential need for market-specific retention strategies.
Older customers demonstrate elevated churn risk.
Customers within the 51–60 age range represent one of the highest-risk customer segments, suggesting that retention strategies should consider customer life stage and changing financial needs.
Inactive members are significantly more vulnerable to churn.
Customers who are not classified as active members show higher churn behavior than active customers.
Customers with multiple products require closer monitoring.
Customers holding three or more products demonstrate elevated churn risk, suggesting that product ownership alone does not necessarily translate into stronger customer retention.
Business Recommendations
- Develop targeted retention campaigns for high-risk customer segments.
- Prioritize customer engagement initiatives for inactive members.
- Investigate Germany-specific churn drivers and develop localized retention strategies.
- Create age-specific engagement programs for higher-risk customer groups.
- Review the customer experience of customers holding multiple products to identify potential friction points.
- Use the dashboard as an ongoing monitoring tool rather than relying solely on periodic churn reporting.
Technical Highlights
- Microsoft Power BI
- Power Query
- DAX Measures
- Data Modeling
- Customer Segmentation
- KPI Development
- Interactive Dashboard Design
- Business Data Storytelling
Business Impact
The dashboard provides management with a centralized view of customer churn and enables faster identification of high-risk segments.
By combining demographic, geographic, financial, product, and engagement characteristics, decision-makers can move from simply measuring churn to understanding where retention efforts should be prioritized.
Skills Demonstrated
- Business Intelligence
- Data Analysis
- Data Visualization
- Customer Segmentation
- KPI Development
- Data Modeling
- Business Storytelling
- Strategic Recommendation Development
Tools Used
- Microsoft Power BI
- Power Query
- DAX
- Microsoft Excel
Project Outcome
This project demonstrates an end-to-end Business Intelligence workflow that transforms customer data into an executive-ready churn analysis dashboard.
The resulting solution helps identify high-risk customer segments, uncover potential churn drivers, and support data-driven customer retention strategies.